Monitoring performance. Showing off your results. Looking for trends in the data. Spotting anomalies. Putting a spotlight on a single indicator, or providing key staff with information-dense consolidated dashboards.
Different goals call for different visualization approaches. We design reports based on your needs and preferences. But in every case, you can expect great readability, a consistent formatting style guide, strategic use of color. And when needed: formulas, joins, pre-aggregation, filters, scripted actions, etc., whatever it takes to support your decision-making.
Different goals call for different visualization approaches. We design reports based on your needs and preferences. But in every case, you can expect great readability, a consistent formatting style guide, strategic use of color. And when needed: formulas, joins, pre-aggregation, filters, scripted actions, etc., whatever it takes to support your decision-making.
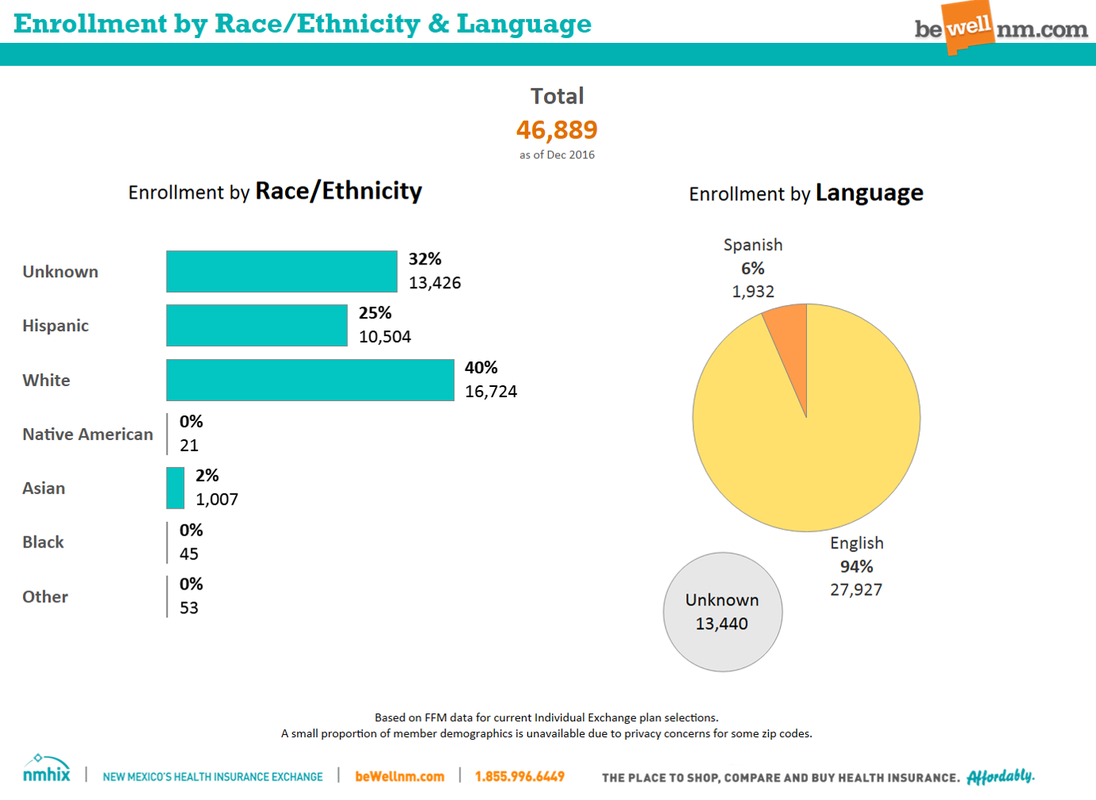
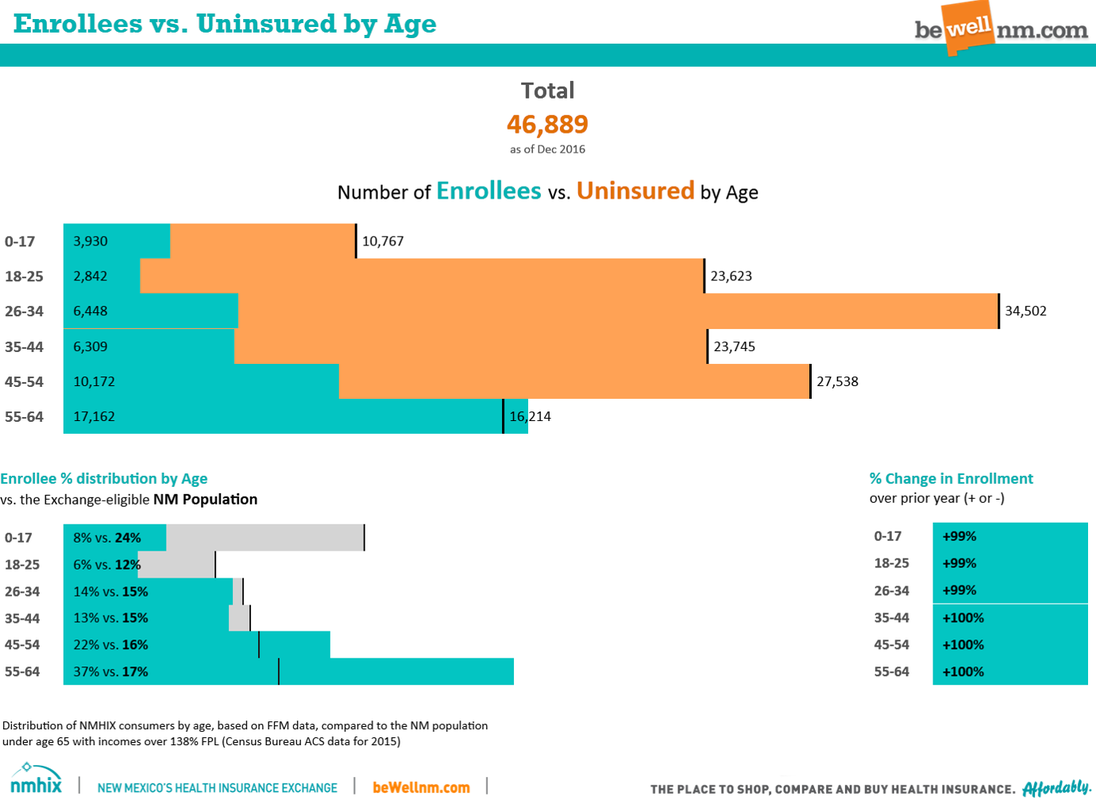
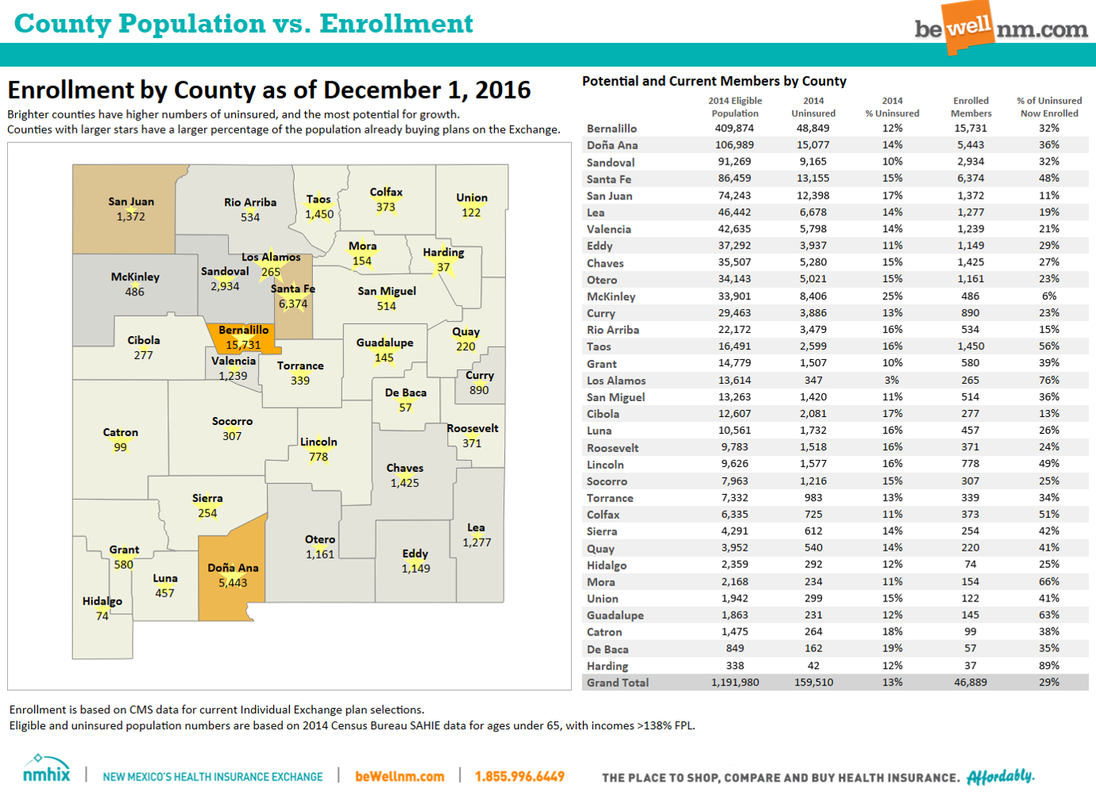
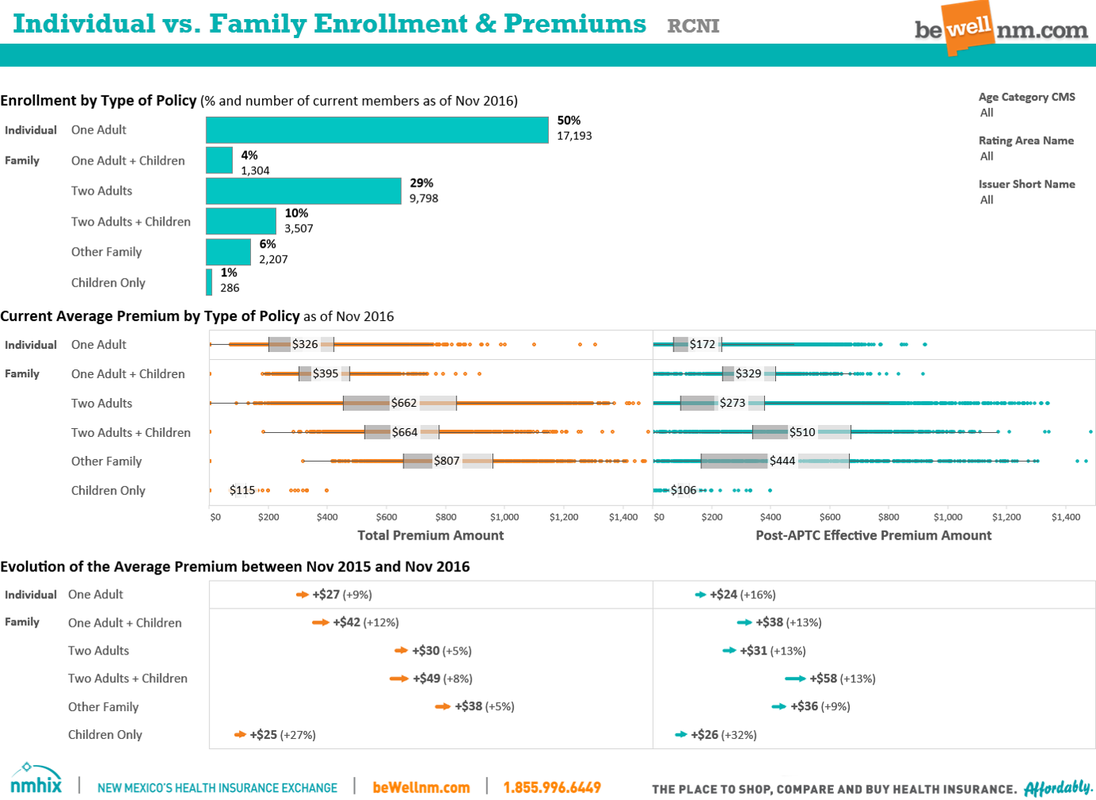
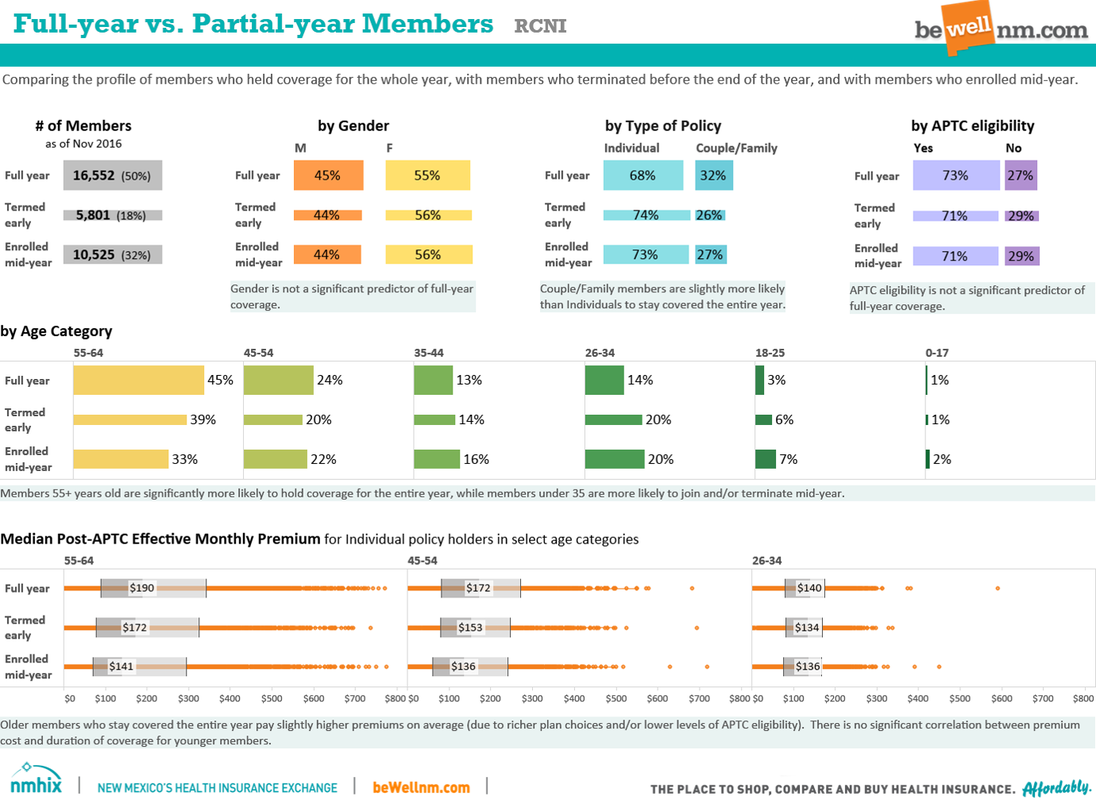
Tableau dashboards & maps
These interactive Tableau dashboards and maps are part of a larger set of reports we created for BeWellNM, New Mexico's Health Insurance Exchange.

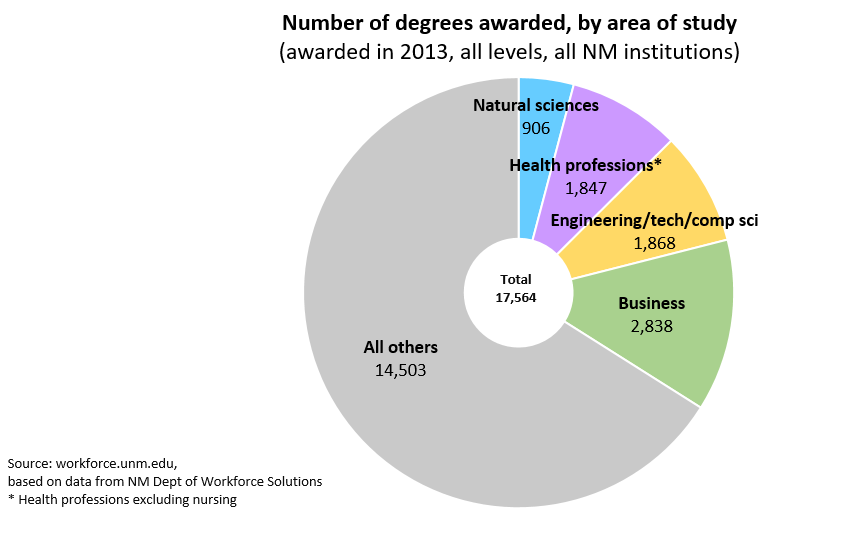
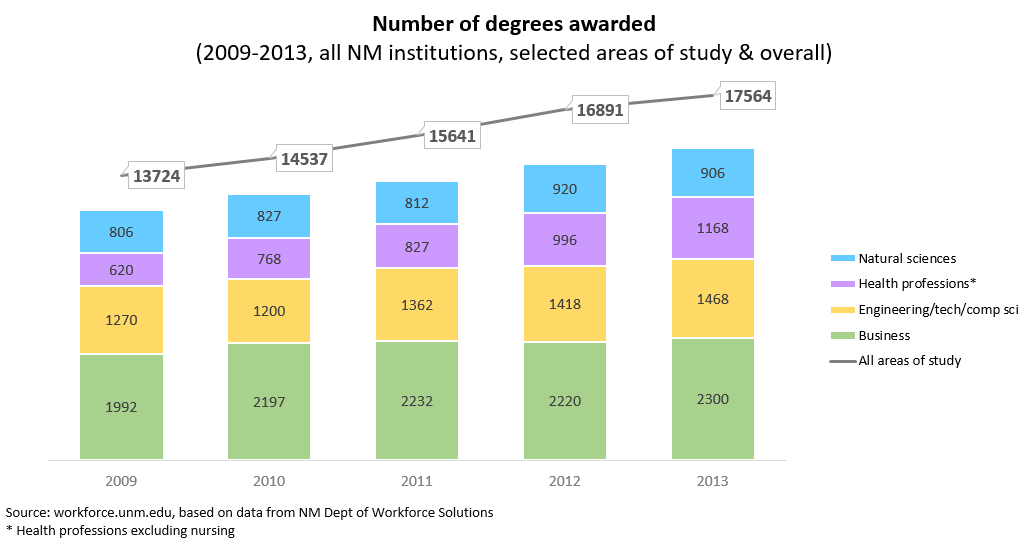
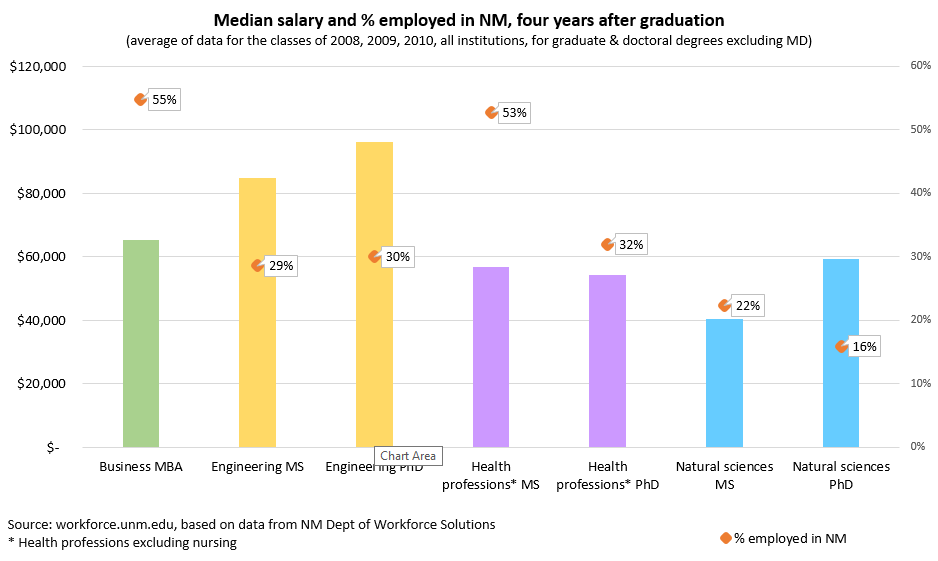
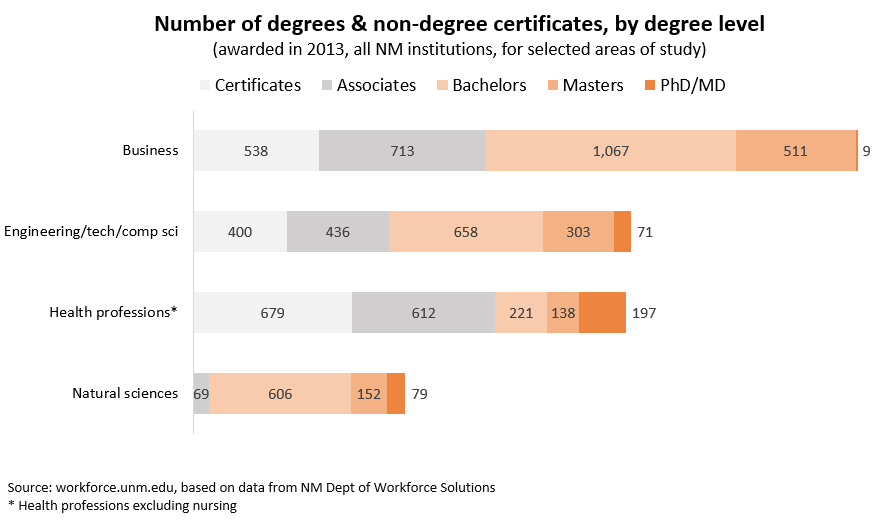
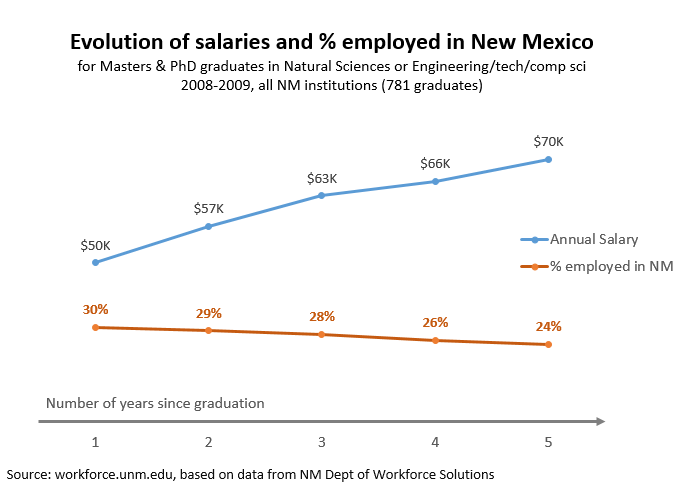
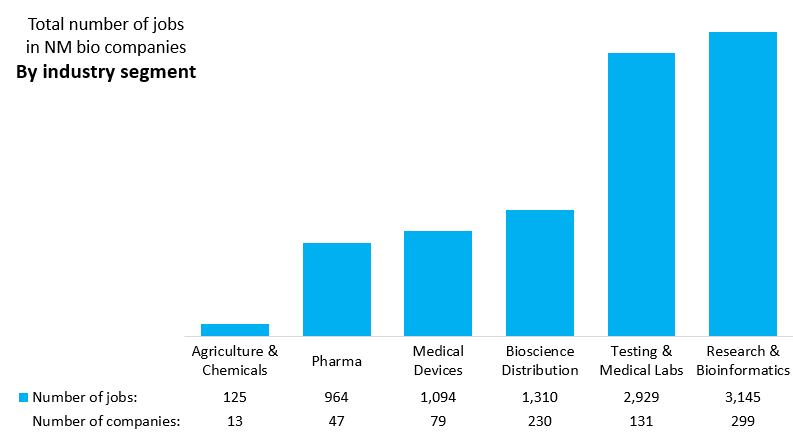
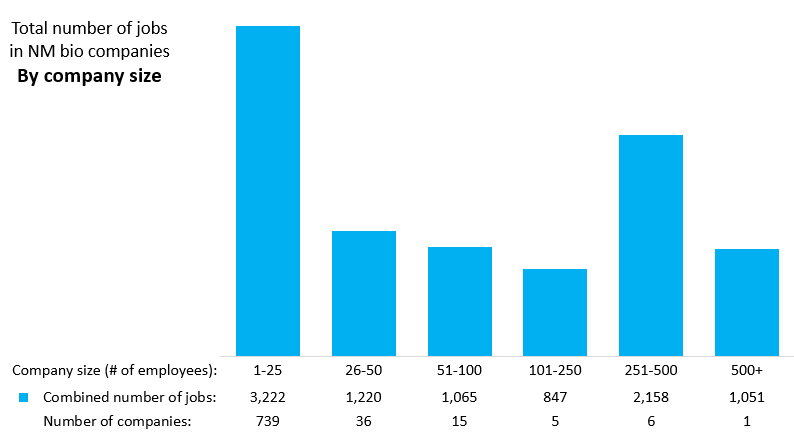
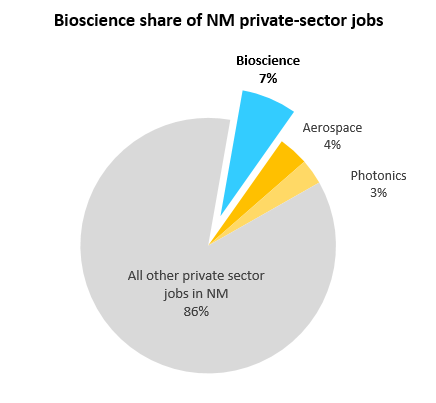
Microsoft Excel charts
We created these Excel charts for the GrowBio Committee, a public-private partnership initiated by the University of New Mexico's Health Sciences Center to stimulate economic development in New Mexico's bioscience industry.

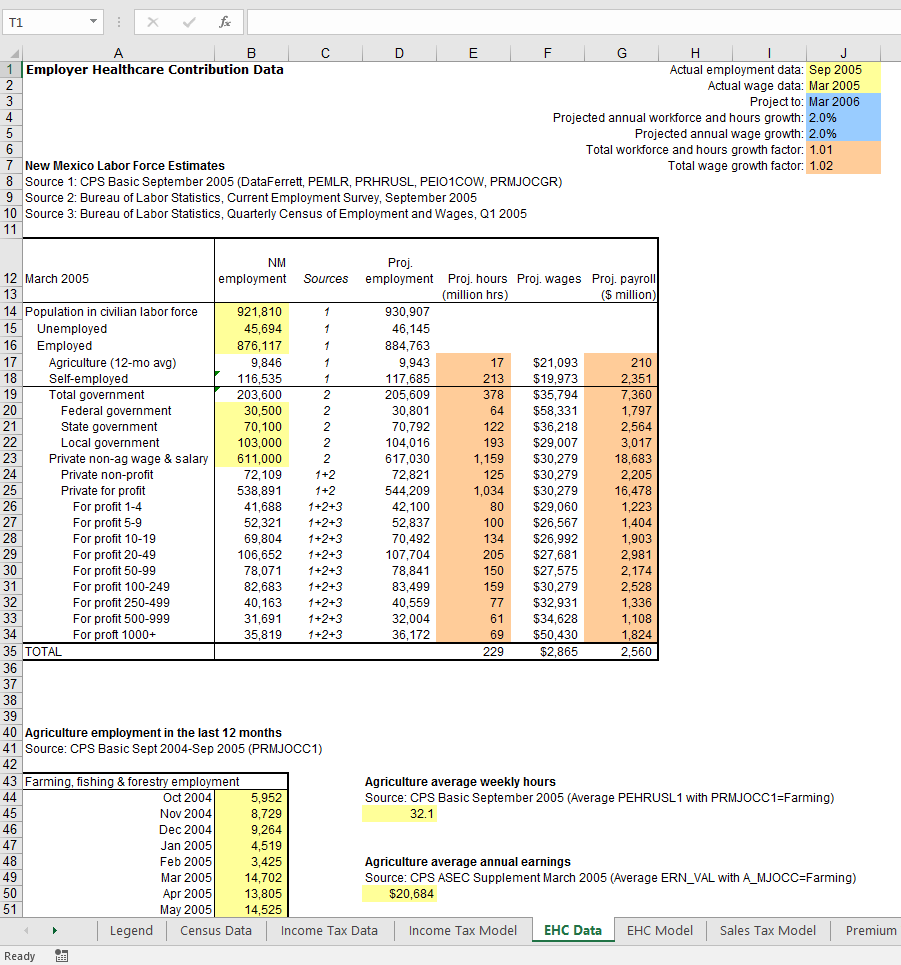
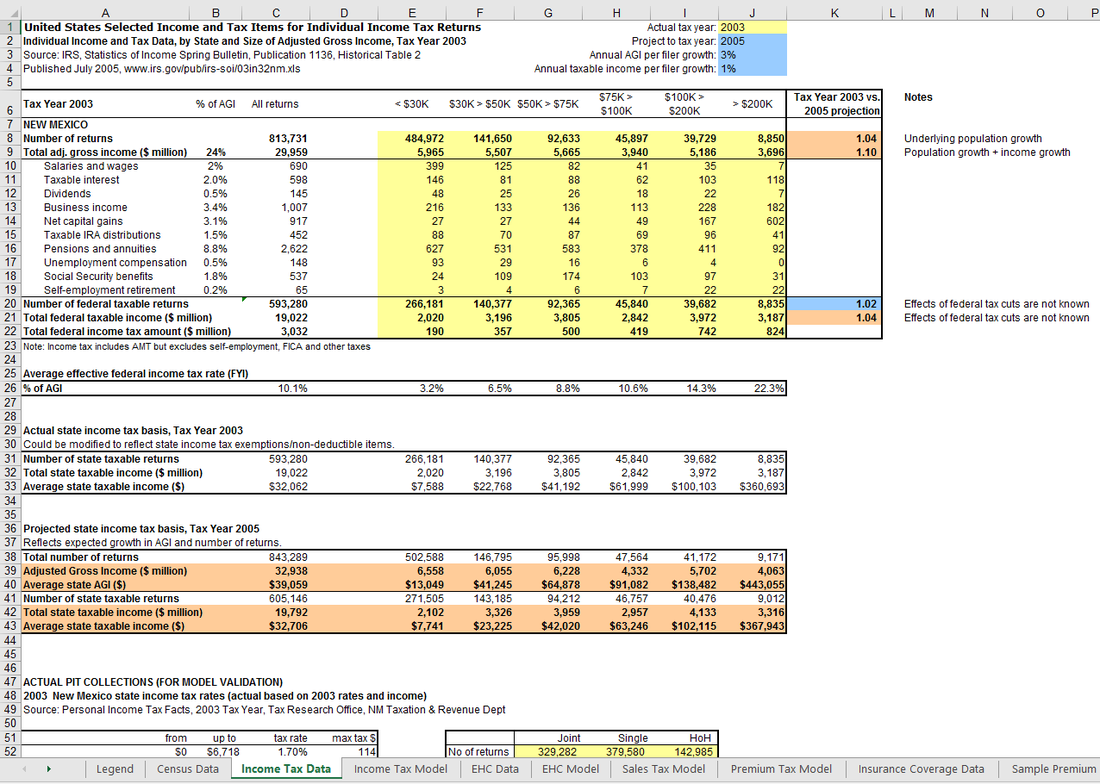
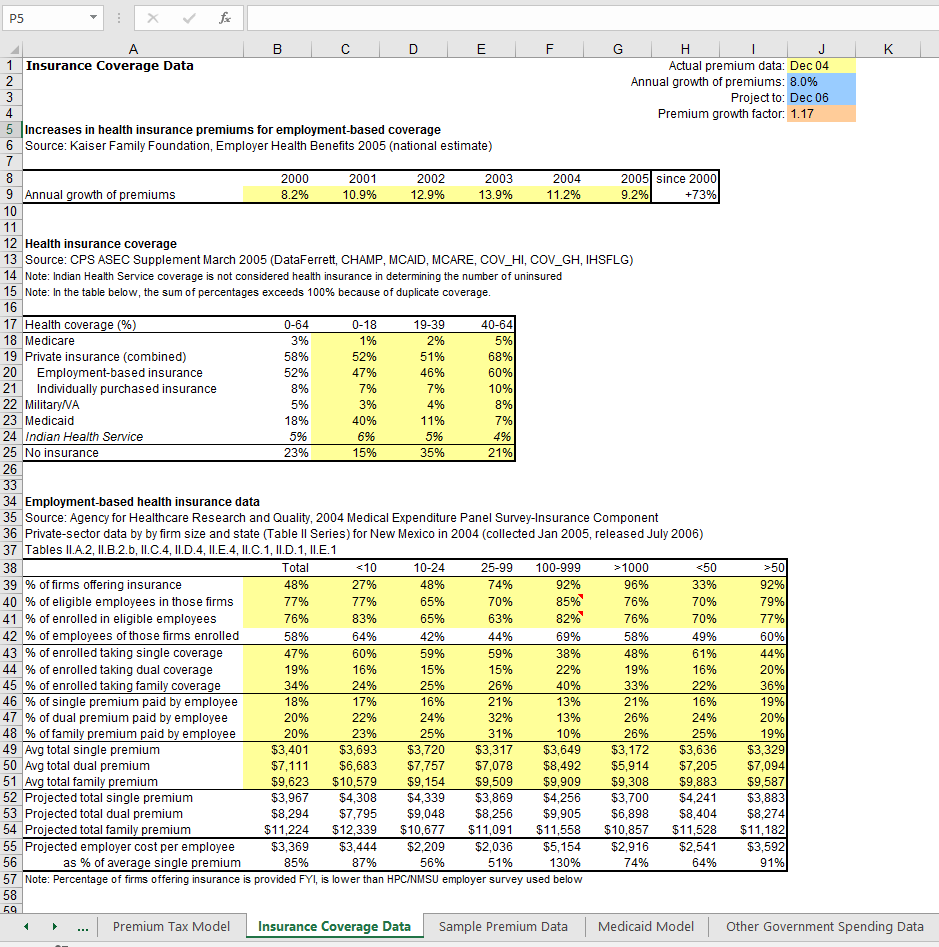
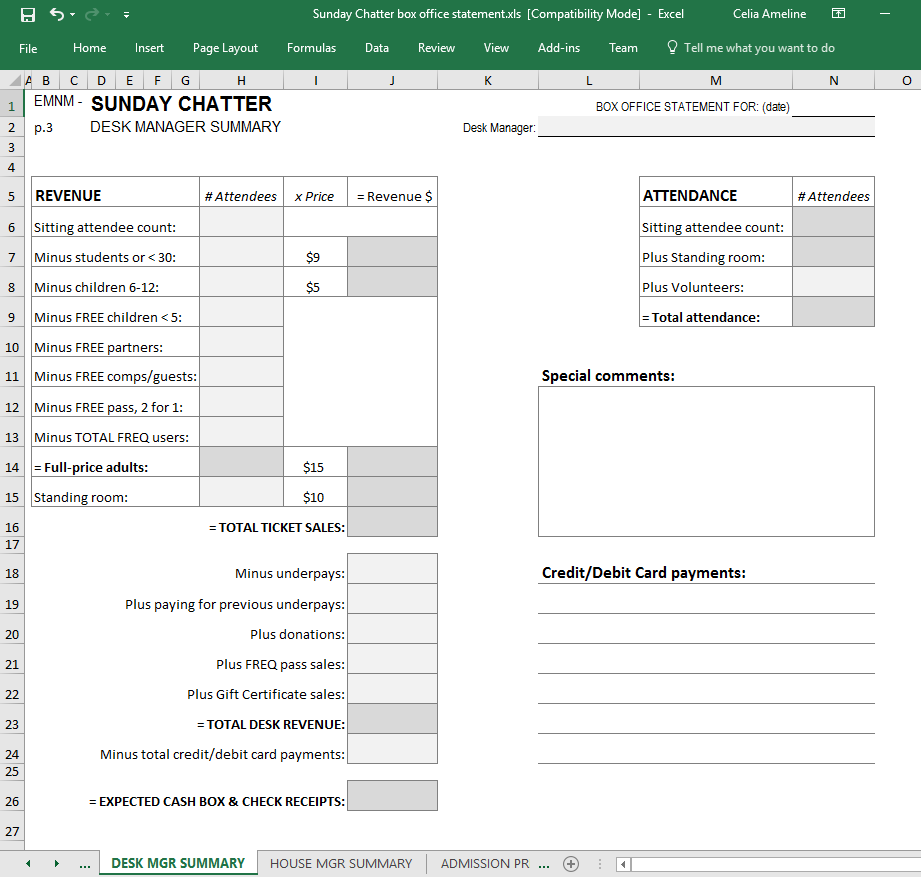
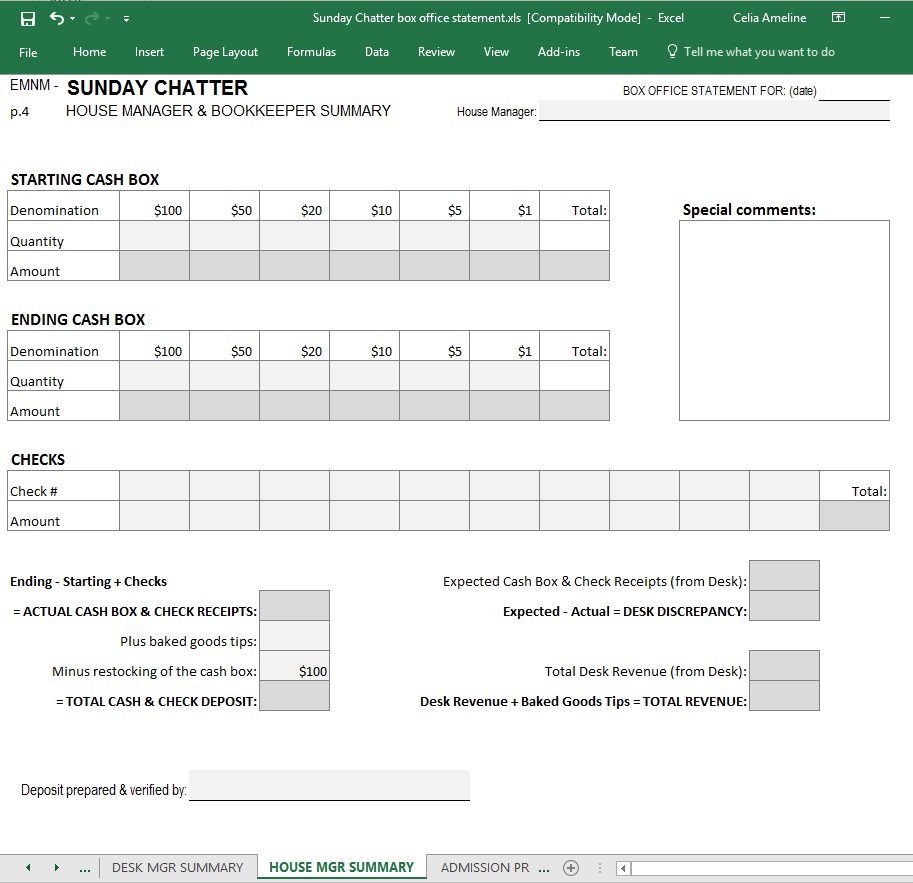
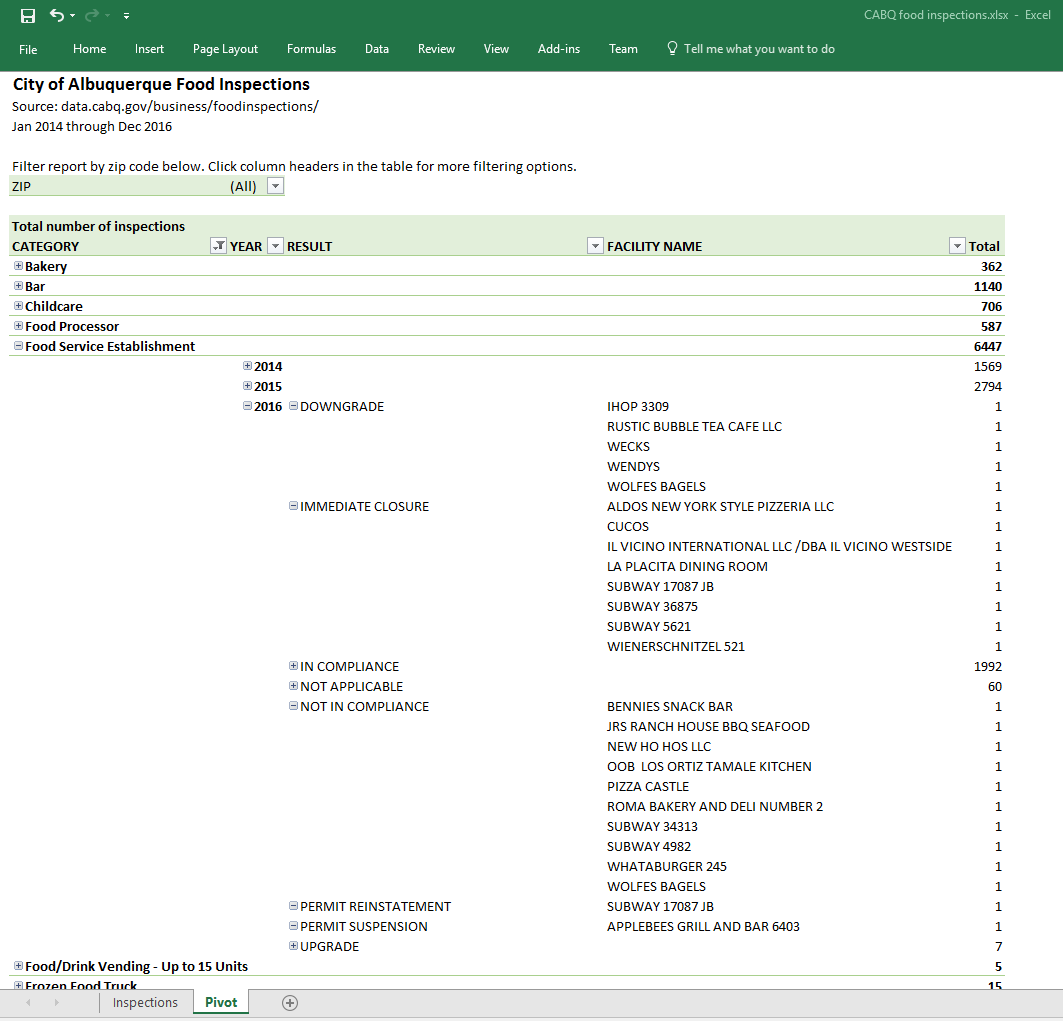
Worksheets, pivot tables & more
We can use Excel for a variety of other purposes. Below are a few tables from our comprehensive, interconnected model of the state's healthcare economy, including the impact of public and private sources of financing for health insurance and services. Also, simple spreadsheets we created for a non-profit classical music concert series to process admissions and reconcile the cash box. And a pivot table that allows exploring public data from the City of Albuquerque's food inspection department.
Microsoft Access reports
Microsoft Access is a great, easy-to-use general-purpose reporting tool. It can query and merge data from a wide variety of data sources, including non-Microsoft databases, spreadsheets, and text files.
It is also uniquely powerful when customizing printable reports, particularly those with text-heavy, master-detail or columnar layouts. If you need to precisely replicate a certain document format, or to give users options over what is printed or hidden in a document, or to handle data entry/import as well as reports in the same program, or to display different reports based on user permissions or other business logic, Access is the best tool to use.
It is also uniquely powerful when customizing printable reports, particularly those with text-heavy, master-detail or columnar layouts. If you need to precisely replicate a certain document format, or to give users options over what is printed or hidden in a document, or to handle data entry/import as well as reports in the same program, or to display different reports based on user permissions or other business logic, Access is the best tool to use.
ETL (Extract, Transform & Load)
Great reporting and visualization requires clean data. We know how to import and prepare data for reporting, how to structure a data warehouse for adequate performance, how to build views that simplify user-driven report development.